Motor Control University
Embedded code implementation - Data Visualization
Graphical User Interface picgui
MPLAB Device Blocks for Simulink provide a simple but powerful graphical user interface. It allows to send and receive data from the chip using a Serial link.
Connection to the PC
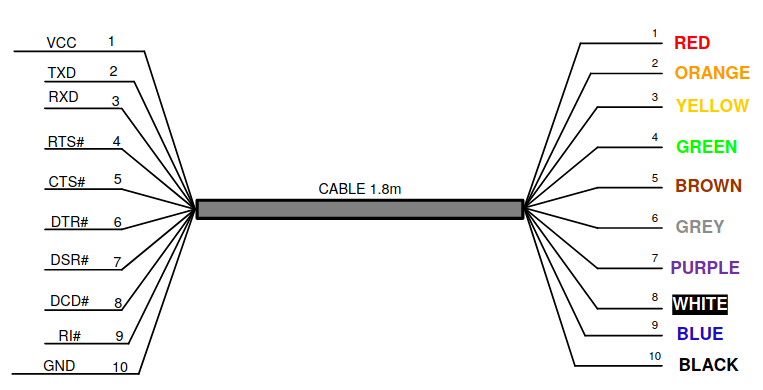
Although the board has ports to connect a serial link (USB, RS232), in this example we are using an special FTDI cable. The USB 2.0 Hi-Speed to UART cable incorporates FTDI’s FT232H USB to UART interface IC device which handles all the USB signalling and protocols. The cable provides a fast, simple way to connect devices with 3.3 volt digital interfaces to USB. FTDI cable Driver
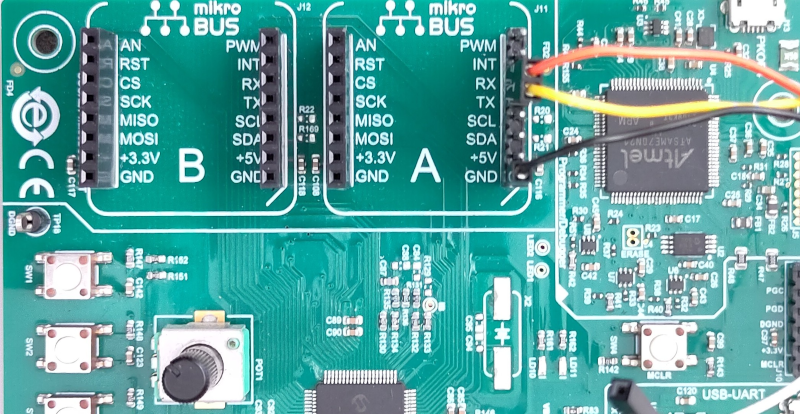
- The TX pin (orange pin 2) must be connected RX pin (mikroBUS A) of the LVMC Board.
- The RX pin (yellow pin 3) must be connected TX pin (mikroBUS A) of the LVMC Board.
- Do not forget to connect the GND (black pin 10) to the LVMC board.
The pin connection is represented below:
picgui
Through a simple GUI the protocol allows the transmission of data from the board to the computer using a serial link. For this purpose, a UART peripheral is configured. This configuration is available inside the dsPIC33CK LVMC block template. In this application the UART 2 Config is used. It is linked to the Mikro BUS A Tx - Rx pins.

The baud rate is set at 921 600 bauds. It allows to send 92160 bytes/s. At \(20\)kHz, it corresponds to 4.61bytes/step. To avoid serial link overflow, it is important to send an amount of information less or equal than this value.
The data to be monitored in real-time time are sent from the program to UART-Tx using UART Tx-Matlab block. For the proposed example, the data sent are as follows:

We want to monitor, the controller mode (which takes 0 for open loop mode and 1 for closed loop mode for , the voltage vector \(v_{dq}\), the current vector \(i_{dq}\), the velocity \(\omega\) with its reference \(\omega^\#\), the max voltage \(V_{\rm max},\) the DC voltage \(V_{\rm DC}\) (which varied depending on modulation types) and the CPU load. Since we’re working using fixed-point variables here, all data is sent in raw form to the serial link and then reconverted on the PC (see Data Type page for details). To avoid overflow, data are sent at different rates (green color corresponding to sampling period of \(5\times10^{-4}\)s and light blue color to \(1\times10^{-2}\)s. On the above figure, we observe that over \(4.61\) bytes/step, \(1.8\) bytes/s are used for the faster task and only 0.06 bytes/step for the slower task. Note that more data could be sent with this baudrate.
On the computer side, once the code has been program on the chip. The PicGui interface allows the data visualization. PicGui is directly accessible from the microchip banner:

It opens the following window:
To monitor the data for the vector control example, enter the name of the script DataVisu.m in the window (download from git).
%DataVisu;
% Scipt DataVisu to be called or copy & past within the picgui script
Tserial = 5e-4;
if ~ishandle(50) figure(50); end % new fig
set(0,'CurrentFigure',50);  % select fig
[A, tUart] = picgui.padr(Rn,7,t_Rn);  % sample on last column data received (remove NaN numbers from the original matrix)
% considere signed values (all channels)
idx = find(A > 65535 / 2);
A(idx)= A(idx)-65536;

if ~isempty(A)
    clf
    t = ([0:(length(A)-1)]  + tUart(1))*Tserial; % Do not rely on UART data arrival timestamp. Recreate time vector
    subplot(3,1,1); plot(t,0.0012*A(:,2:3)); axis tight; ylabel('v_d_q (in V)'); ylim([-20 20]);
    subplot(3,1,2); plot(t,6.6620e-04*A(:,4:5)); axis tight; ylabel('i_d_q (in A)'); ylim([-10 10]);
    subplot(3,1,3); plot(t,[A(:,6:7)]); axis tight; ylabel('om, omr (in rad/s)'); ylim([-500 500]);
    xlabel('time (in s)')


    dim=[0 .9 .1 .1] ;
    if(A(end,1)==0)
    annotation('textbox',dim,'String',sprintf('Mode = BO'));
    elseif(A(end,1)==1)
    annotation('textbox',dim,'String',sprintf('Mode = Speed'));
    end


    dim=[0.25 .9 .1 .1] ;
    str = 'vDC = %.2f V';
    annotation('textbox',dim,'String',sprintf(str,0.001057*A(end,9)));
    dim=[0.5 .9 .1 .1] ;
    str = 'vMAX = %.2f V';
    annotation('textbox',dim,'String',sprintf(str,0.0012*A(end,8)));
    dim=[0.75 .9 .1 .1] ;
    str = 'CPU = %.2f %%';
    annotation('textbox',dim,'String',sprintf(str,2^-8*A(end,10)));
end
This script retrieves the data and puts it back into the correct format for viewing. As the result, data visualization should looks like the figure below


 GitHub
 YouTube


